Mean, Medien, and Mode
Published: Feb 11, 2025
I know you are familiar with all three of them and you may or may not used them before in your projects , but if you are like me don’t want to just study theoretical terms without knowing why and when you are going to use them in real world , i will try to make it stick to your brain , so that if you are facing a problem that needs you to use one of these three terms , you don’t get stuck what to do or which term of them to use.
Mean , Medien, and Mode these 3Ms are estimates of location, meaning that you can give an estimation (overlook) of a population or Data so that it would be easy for you to say this data can be described/shortened into one number.
Mean: The Average - "The Big Picture"
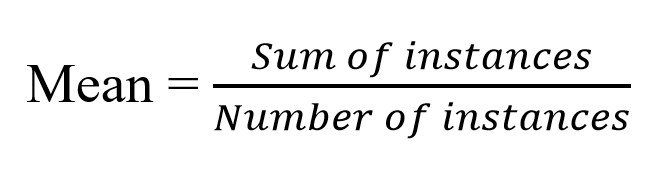
The mean is simply the sum of all values divided by the number of values. Suppose we have a group of mice, and we’ve measured their weights in grams:
[28, 29, 30, 26, 22, 24, 28, 23, 24, 33]
To find the mean, we sum up all the weights: 267 grams. Then we divide by the number of mice (10):
Mean = 267 / 10 = 26.7 grams
that translated to:

Median: The Middle Value - "The Fair Middle"
The median is another way to find the “center” of the data, but instead of averaging everything, we arrange the values in ascending order and find the middle number. If there’s an even number of values, we take the average of the two middle numbers.
Sorted weights: [22, 23, 24, 24, 26, 28, 28, 29, 30, 33]
Since we have an even number of values (10), the two middle numbers are 26 and 28. Their average gives us the median:
Median = (26 + 28) / 2 = 27 grams
Mode: The Most Frequent Value - "The Most Common One"
The mode is the most common value in the dataset. Looking at our mice weights again, we see that 24 and 28 each appear twice, while all other numbers appear only once.
Since we have two values appearing most frequently, we say this dataset has two modes (24 and 28).
Great Now What ?

At this point, you might be thinking: “Cool, but why does this matter? Why would I ever care about the mean, median, or mode of a group of mice?”
Well, as my friend “Digga” would say: Now you have an estimation of what your group of mice looks like. daaa
That’s useful, but let’s push it further. If the mean weight of your mice was 35 grams instead of 26.7 grams, that would indicate they’re much heavier than average, perhaps overweight. With this simple calculation, you already have an insight into the general condition of your group. And in other real-world scenarios, like analyzing salaries, house prices, or patient health data, these three measures can help make sense of large datasets quickly.
Manufacturing Quality Control: Mean vs. Median
Let’s say we have this Scenario: A factory produces bottles of juice and needs to ensure each bottle contains 500 mL of juice.
Using the Mean: The company measures 100 bottles and finds the average (mean) volume is 500 mL.
Sounds good, right? But if some bottles have 480 mL and others have 520 mL, customers will complain.
But when the Median: The company checks the median and finds it’s 495 mL.
This means thefirst half the bottles have less than 495 mL, which is a problem. Even though the mean says "everything is fine," most customers get underfilled bottles!
Decision: The company adjusts the filling machine to center around 500 mL (median) rather than relying only on the mean.
Detecting Anomalies in Production: Mean vs. Mode
Scenario: A car factory measures the diameter of brake discs to ensure they meet the standard of 30 cm.
Mean diameter: 30.2 cm
Mode diameter: 30 cm
The mean is slightly off, but the mode shows most discs are actually correct.
A few faulty discs (e.g., 32 cm) pushed up the mean.
Decision:
The factory doesn’t panic because the mode shows most discs are fine.
However, they inspect outliers to prevent defective discs from reaching customers.
Sales Analysis: Mean vs. Mode
Scenario: A retailer sells smartphones and wants to decide which price range to focus on.
Mean selling price: €750
Mode (Most common selling price): €500
The mean is inflated because some customers buy high-end €1,500 phones.
The mode tells them that most customers buy €500 phones.
Decision:
Instead of pushing expensive phones, they increase stock and promotions for €500 models to match customer demand.
Useful Links: